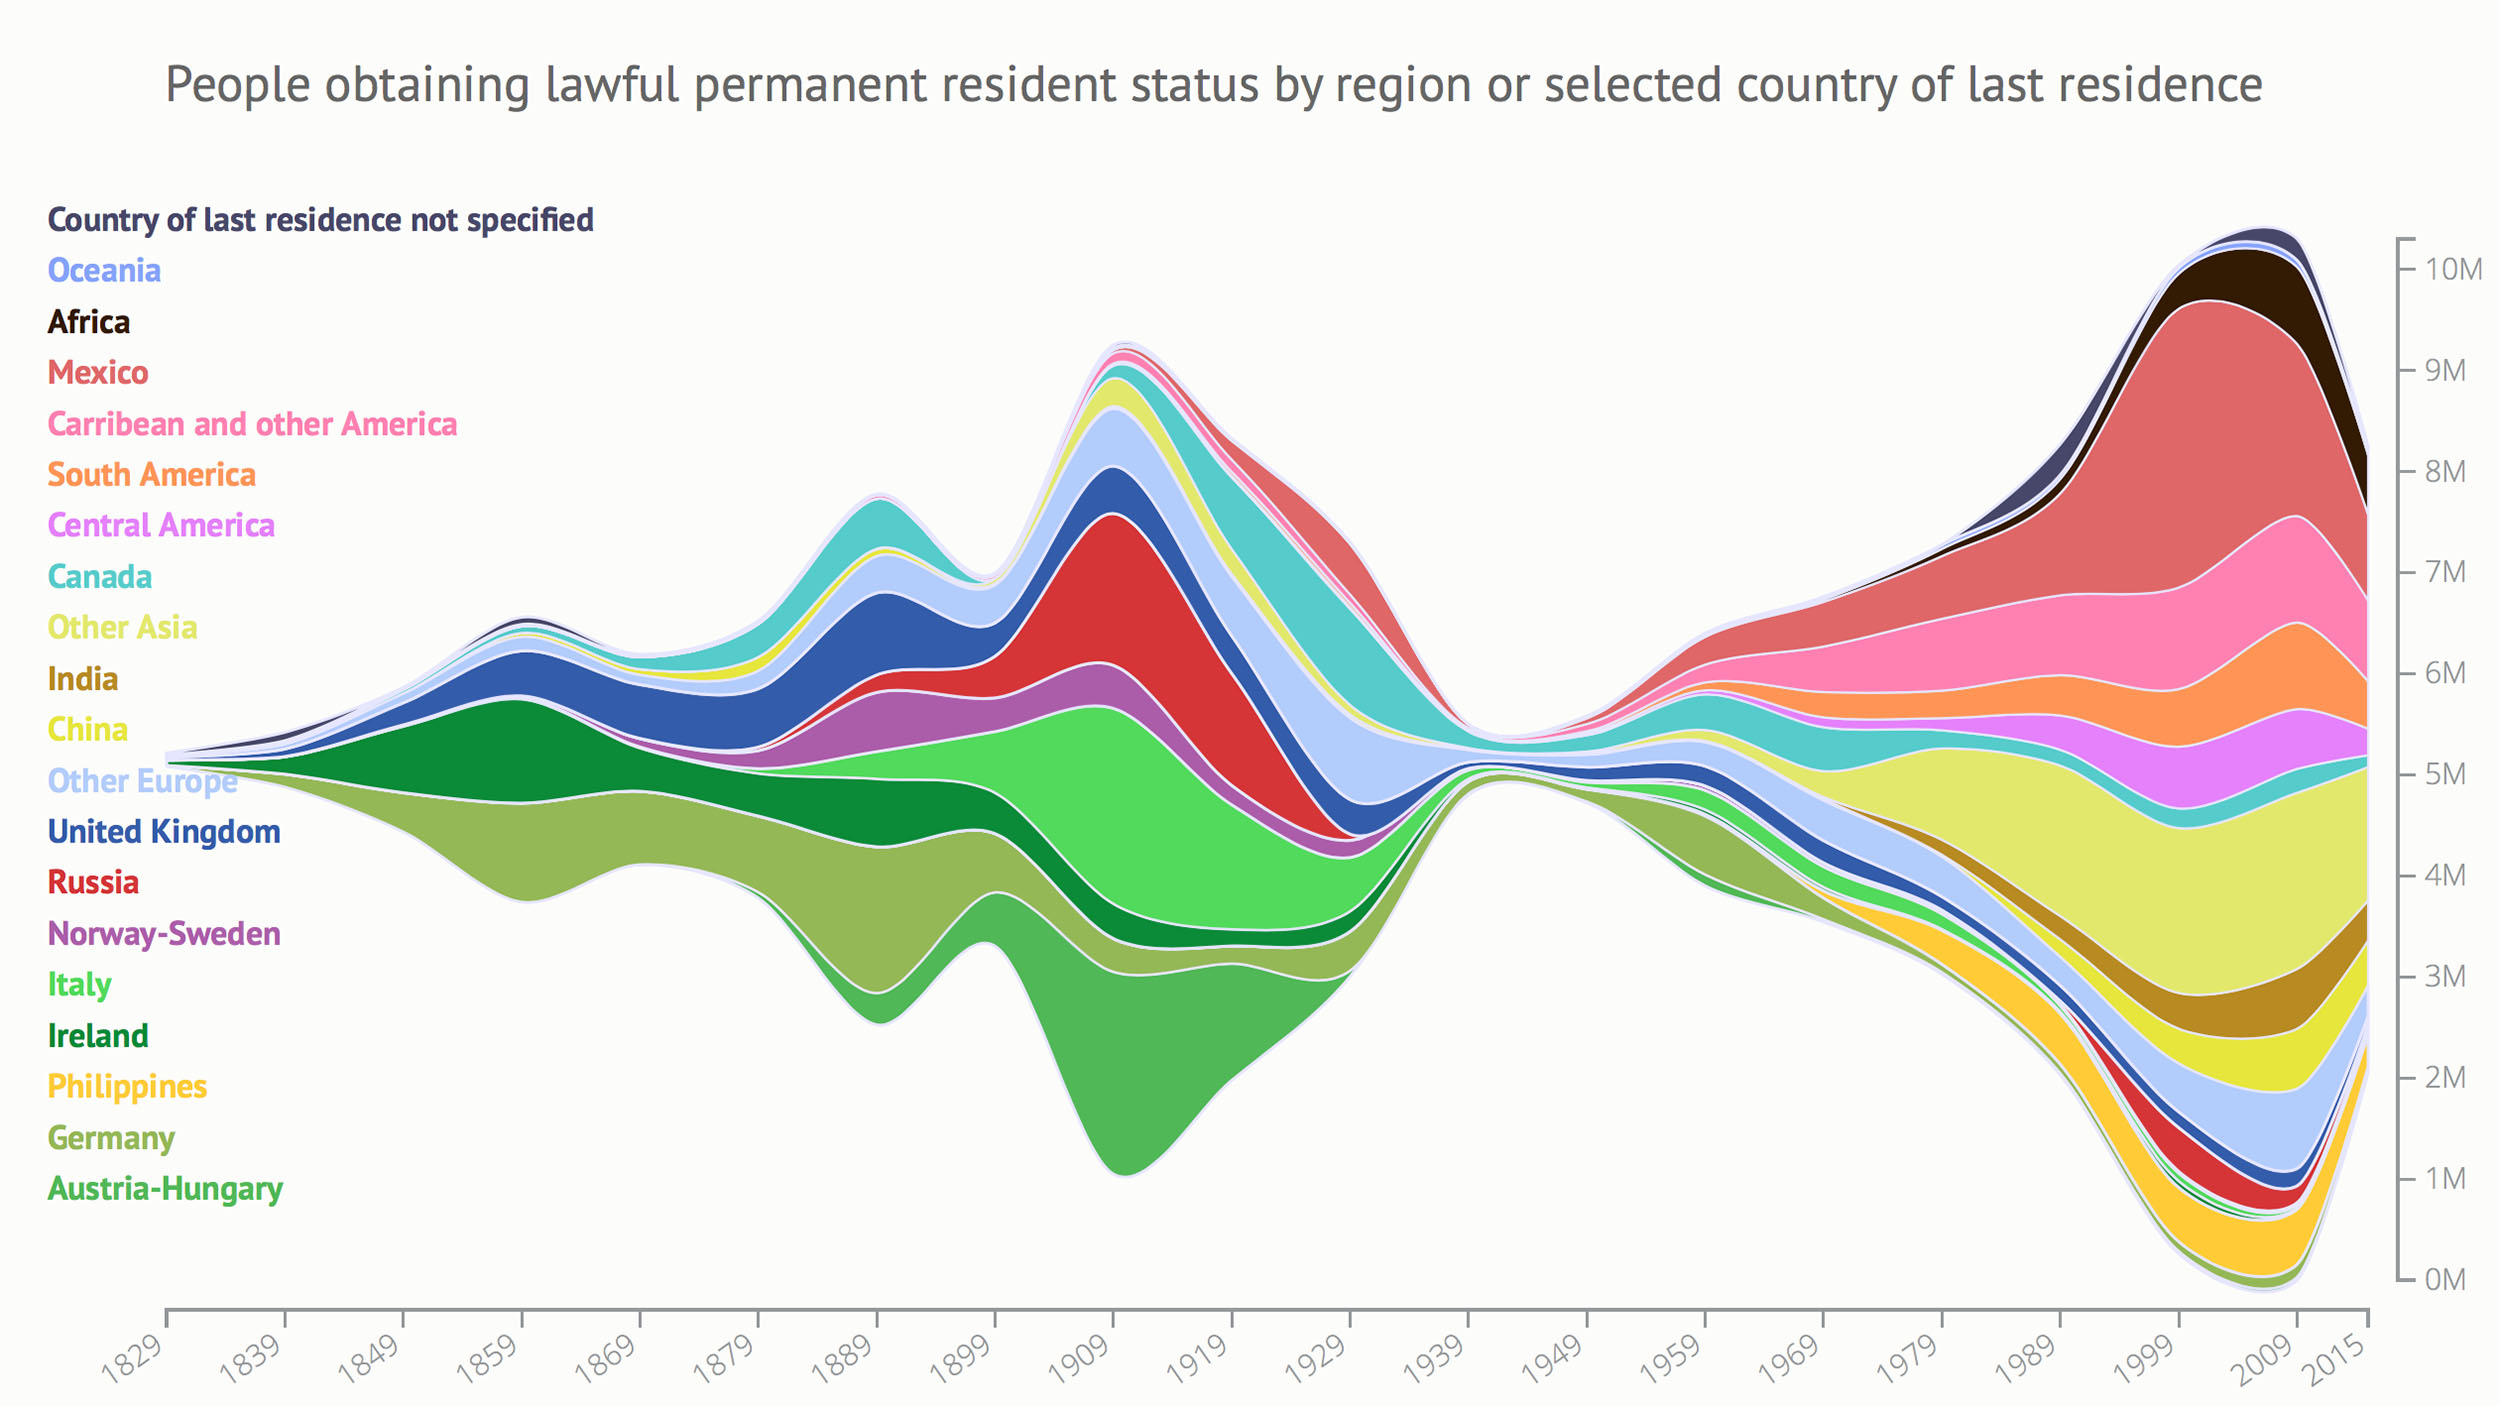
U.S. Immigration has historically been driven by many factors such as immigration laws, war, the great depression and industrial revolution, to name a few. This beautiful chart by Talia Bronshtein captures 200 years of government data on new permanent residents by their origin.
Click image to view full size. Source: Talia Bronshtein
The Number of US Immigrants by Origin Over 200 Years
This fascinating visual tells a clear story of immigration flows shaped by world events and two key Congressional Acts that transformed US immigration.
The Immigration Act of 1924 Barred Immigrants from Asia and the Middle East
The Immigration Act of 1924 made immigration much less diverse and severely restricted “undesirable” immigration using a strict quota system that barred immigrants from Asia and the Middle East. The Act declared that only people of white or African descent were eligible for naturalization and it blocked further immigration of anyone who would not be eligible for naturalization. The Act placed no restrictions on immigration from Latin American nations. The effects of the 1924 Act were extreme. One example is Italian immigration plummeted from 210,000 per year before the Act to 4,000 per year after.
The 1930s Depression & World War II (1939-1945) Caused US Immigration to Plummet
According to the US census bureau, between 1930 and 1950, the foreign born population in the US shrunk from 14.2 down to 10.3 million. When the war ended, the US passed legislation allowing refugees from the Soviet Union and Europe to come to the US. After Cuba’s Communist revolution in 1959, hundreds of thousands of Cubans were also allowed into the US.
The Hart-Cellar Act of 1965
The Immigration and Nationality Act of 1965 was passed at the height of the Civil Rights Movement. The Act marked a radical break from the past and removed prior racial and national barriers. The new laws maintained per country limits, but added visa preferences focused on immigrant skills and family relationships. Immediate family relatives and special immigrants were not subject to caps. As the infographic above shows, there was a significant increase in immigrants from Latin America, Asia, Africa and the Middle East following passage in 1965.

About the author
Tsion Chudnovsky is an immigrant to the United States and founder of Chudnovsky Law, a California based law firm practicing in the areas of criminal immigration, professional license defense, criminal defense, dui and injury law.
You can connect with Tsion on LinkedIn, Twitter and Facebook.
You can view an interactive version of the graphic on Talia Bronshtein’s site where you can hover over any point to see the number immigrants that became permanent residents at that time.